Fang Ping Wu,
Yong Yang,
Liang Hong Liu,
Hong Pu,
Ping Jin,
Zu Hu Yao ![]() ,
Wei Cai
,
Wei Cai
For correspondence:- Zu Yao Email: 20120941161@bucm.edu.cn Tel:+867452381253
Received: 21 October 2015 Accepted: 20 February 2016 Published: 31 March 2016
Citation: Wu FP, Yang Y, Liu LH, Pu H, Jin P, Yao ZH, et al. Profiling and identification of the metabolites of evodiamine in rats using ultra-performance liquid chromatography with linear ion trap orbitrap mass spectrometer. Trop J Pharm Res 2016; 15(3):623-629 doi: 10.4314/tjpr.v15i3.26
© 2016 The authors.
This is an Open Access article that uses a funding model which does not charge readers or their institutions for access and distributed under the terms of the Creative Commons Attribution License (http://creativecommons.org/licenses/by/4.0) and the Budapest Open Access Initiative (http://www.budapestopenaccessinitiative.org/read), which permit unrestricted use, distribution, and reproduction in any medium, provided the original work is properly credited..
Purpose: To develop a highly sensitive and specific ultra-performance liquid chromatography with linear ion trap Orbitrap mass spectrometer (UPLC-LTQ-Orbitrap) method to profile and identify the metabolites of evodiamine in rats.
Methods: First, blood samples were collected after oral administration of evodiamine to rats (50 mg/kg). Next, the plasma samples were pretreated using a solid-phase extraction (SPE) method. Finally, all the samples were analyzed by ultra-performance liquid chromatography LTQ-Orbitrap mass spectrometry (UPLC-LTQ-Orbitrap) coupled with electrospray ionization source (ESI) in negative mode.
Results: A total of 7 metabolites (2 phase I and 4 phase II metabolites, including 4 new metabolites, viz, 10-hydroxyevodiamine sulfate, 10-hydroxyevodiamine sulfate, 10-hydroxyevodiamine glucuronide and 3-hydroxyevodiamine glucuronide) as well as the parent drug itself , were detected and identified based on accurate mass measurements, fragmentation patterns, and chromatographic retention times. The in vivo metabolic reactions of evodiamine in rats were hydroxylation, hydroxylation + sulfate conjugation, and hydroxylation + glucuronidation.
Conclusion: These results provide better understanding of the metabolism of evodiamine as well as strong indications of the effective forms of the drug in vivo.
Introduction
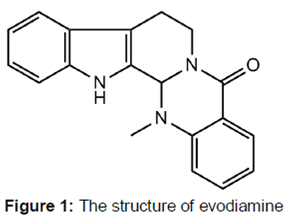
Evodiamine belonging to indoloquinazoline alkaloids, is a major constituent isolated from the herbal medicine Evodia rutaecarpa (Wu-zhu-yu), which has been officially listed in Chinese Pharmacopoeia [1] and widely used in China for more than 2000 years. Pharmacological studies indicate that it possesses variety of anti-thrombotic, anti-inflammatory, uterotonic, thermoregulatory, anti-obesity, hypotensive, and vasodilatory effects [2-5].
Previous reports demonstrated that evodiamine had low oral bioavailability in rats [6,7], which suggested that evodiamine might undergo an extensive first-pass metabolism. Pharmacological studies have revealed the cytotoxicity of evodiamine might be related to the transformation of evodiamine into its 10-hydroxyevodiamine or other metabolites [8]. However, so far as we are aware, the biotransformation of evodiamine has not been fully investigated due to the limitations of analytical techniques [8-10]. For instance, only two and five metabolites were detected and identified in vivo and in vitro, respectively [8-11]. In this respect, it is important to characterize its metabolism profile in vivo, which can help to further understand the mechanism of action of evodiamine.
During the past decade, liquid chromatography/electrospray tandem mass spectrometry was the main method for the structural characterization of drug metabolites in vivo and in vitro [12,13]. Ultra–high performance liquid chromatography coupled with high–resolution mass spectrometer (UPLC-HRMS) such as UPLC-LTQ-Orbitrap significantly contributes to the characterization of drug metabolites due to its higher separation and resolution capacities in a shorter time [14,15].
The principal metabolic pathways of evodiamine in rats were proposed for the first time in this study. This study is also useful to understand the drug’s pharmacological effects.
Methods
Chemicals and reagents
Evodiamine was isolated from the 95 % aqueous ethanolic extract of Euodiae Fructus in our laboratory. Its structure was identified by comparing their UV, MS, 1H-NMR and 13C-NMR data with it’s in the literature. Its purity was > 98 % by HPLC analysis. The structure is displayed in . Grace PureTM SPE C18 phase extraction cartridges (200 mg/3 mL, 59 μm, 70 Å) were purchased from Grace Davison Discovery ScienceTM (Deerfield, IL, USA). Ultra-pure water used throughout the experiment was freshly prepared using a Milli-Q water purification system (Millipore, Billerica, MA, USA). Acetonitrile was of HPLC-grade (Fisher, NJ, USA). All other chemicals and reagents were of analytical grade and commercially available.
Animals and drug administration
Six male Sprague-Dawley rats (weighing 200 – 250 g) were supplied by Beijing Weitong Lihua Experimental Animals Company (Beijing, China) and housed in controlled environmental conditions (temperature, 24 ± 2 oC; relative humidity, 70 ± 5 %) with free access to food and water in a week for acclimatization. The rats were randomly divided into two groups: Group A (n = 3), drug group for plasma; Group B (n = 3), control group for blank plasma. Before the experiment, all rats were fasted for 12 h and fed with water. Evodiamine was suspended in 0.5 % carboxymethylcellulose sodium (CMC-Na) aqueous solution. The rats from group A were anesthetized with ether at 2 h after oral administration of evodiamine at a dose of 100 mg/kg body weight and then sacrificed by decapitation. The rats from group B were oral administrated with 0.5 % CMC-Na aqueous solution in the same way. The blood were withdrawn in heparinized centrifuge tubes and centrifuged at 4000 rpm for 10 min to obtain the plasma. All plasma samples were stored at – 20 °C until other pretreatment and analysis. The animal experiments were carried out in accordance with the guidelines for Animal Experimentation of Hunan University of Medicine, and the protocols were approved by the Animal Biomedical Ethical Committee of Hunan University of Medicine (approval ref no. kj-dw-20150901-01) [16].
Sample preparation
All plasma samples were pretreated by a solid-phase extraction (SPE). An SPE cartridge was pretreated with 5 mL of water, 5 mL of methanol and 5 mL of water, successively. 1 mL sample of plasma was loaded, and allowed to flow through the SPE cartridge with gravity. The SPE cartridge was washed with 5 mL of water and 5 mL of methanol, successively. The methanol eluate was collected and evaporated to dryness under N2 at room temperature. The residue was re–dissolved in 100 µL of acetonitrile/water (10:90, v/v) and centrifuged at 12,000 rpm at 4 oC for 30 min. A volume of 2 µL supernatant was injected into UPLC-LTQ-Orbitrap MS for analysis.
Instrumentation and conditions
All LC/MS analyses were performed on a Finnigan LTQ/Orbitrap (Thermo Electron, Bremen, Germany) coupled to an ESI source (Thermo Electron, Bremen, Germany). A Waters ACQUITY BEH C18 column (2.1 × 100 mm i.d., 1.7 μm) was used for separation of the metabolites at room temperature and a flow rate of 0.3 mL/min. The mobile phase consisted of water (solvent A) and acetonitrile (solvent B) using a gradient elution as follows: 0 – 2 min, 5 % B; 2 – 3 min, 5 – 10 % B; 3 – 25 min, 10 – 35 % B; 25 – 30 min, 35 – 80 % B; 30 – 35 min, 80 % B; 35 – 36 min, 80 – 5 % B; 36 – 40 min, 5 % B.
Samples were analyzed in the negative mode with the tune method set as follows: sheath gas (nitrogen) flow rate of 30 arb, aux gas (nitrogen) flow rate of 5 arb, spray voltage of 4.0 kV, capillary temperature of 350 ℃, capillary voltage of 25 V, tube lens voltage of 110 V.
In the full scan experiment, resolution of the Orbitrap mass analyzer was set at 30,000 and with a mass range of m/z 100 – 800. Data-dependent MS/MS scanning was performed to minimize total analytical time as it can trigger fragmentation spectra of target ions. The collision energy for collision induced dissociation (CID) was adjusted to 30 % of maximum, and the isolation width of precursor ions was m/z 2.0 Da.
Peak selections and data processing
Thermo Xcaliber 2.1 workstation was used for the data acquisition and processing. In order to obtain as many fragment ions of the metabolites as possible, the peaks detected with intensity over 10,000 were selected for identifications. The chemical formulas for all parent ions of the selected peaks were calculated from the accurate mass using a formula predictor by setting the parameters as follows: C [0 – 30], H [0 – 50], O [0 – 20], S [0 – 4], N [0 – 4], Cl [0 – 4], and ring double bond (RDB) equivalent value [0 – 15]. Other elements such as P and Br were not considered because they are rarely present in the complex matrix.
Results
Fragmentation pathway of evodiamine
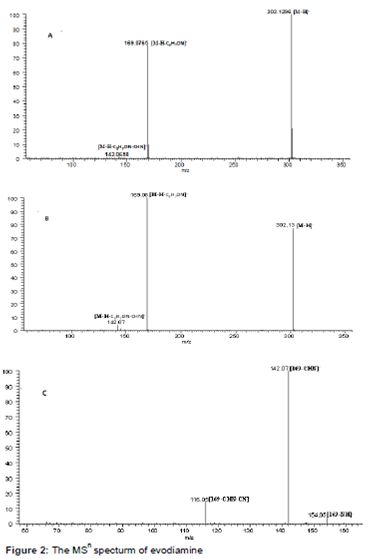
In order to facilitate the structural identification of the metabolite, the MSn fragmentation pattern of evodiamine was investigated [17]. The parent ion showed a deprotonated ion [M-H]- at m/z 302.1296 (2.8 ppm, C19H16ON3) in negative mode. Fragmentation of the parent ion provided characteristic fragment ions at m/z 169.0765 (2.5 ppm, C11H9N2) and m/z 142.0658 (4.7 ppm, C10H9N) by the loss of the moieties C8H7ON and C8H7ON +CNH, respectively, which were useful information in metabolite identification. Besides, the fragment at m/z 142 can be formed by loss of CNH from the ion at m/z 169 in the MS3 spectra. The MSn spectrum of evodiamine was shown in .
Detection and structural elucidation of metabolites
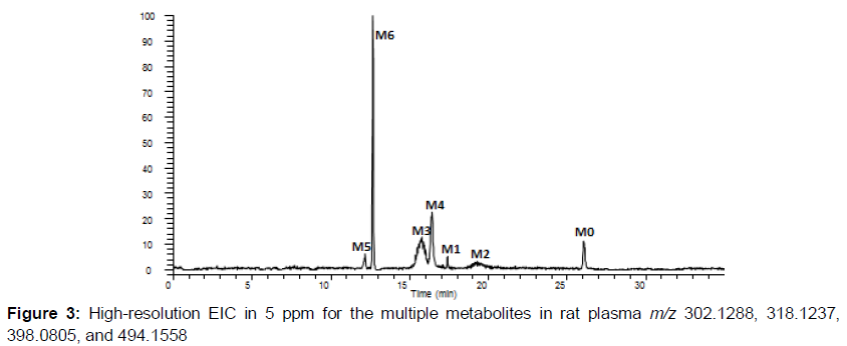
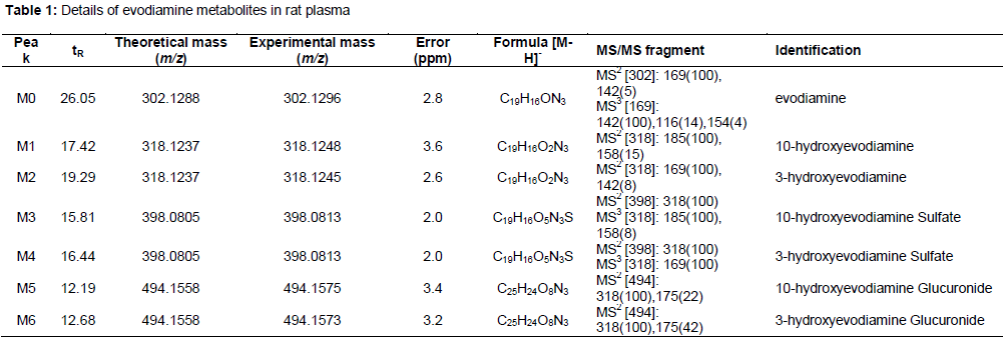
After comparison the high-resolution EIC (HREIC) of the drug samples with corresponding control samples, a total of 7 metabolites as well as the parent drug were detected and identified. The HREIC of drug sample is shown in . The chromatographic and mass spectrometric data of the parent drug and its metabolites are shown in .
Metabolite M0
Metabolite M0 was unambiguously identified as evodiamine by comparing the retention time, accurate MS and MS/MS spectra with the authentic reference.
Metabolites M1 and M2
Metabolites M1 and M2 were eluted at 17.42 and 19.29 min with the quasi-molecular ions of m/z 318.1248 (3.6 ppm, C19H16O2N3) and m/z 318.1245 (2.6 ppm, C19H16O2N3), 16 Da more than that of evodiamine, indicating that it might be the product of mono-hydroxylated of the prototype drug. This ion at m/z 185 in M1 MS2 spectra was found to be characterization for the presence of a hydroxyl group at one of the positions of the aromatic ring of the indole moiety. Based on these results, metabolite M1 were proposed to be mono-hydroxylated on the indole ring. This ion at m/z 169 in M2 MS2 spectra belonged to the aromatic ring of the indole moiety, suggesting that metabolite M2 were proposed to be no mono-hydroxylated on the indole ring. Previous reports [11] showed that the metabolites 10-hydroxyevodiamine and 3-hydroxyevodiamine of evodiamine is easy to produce, therefore, M1 and M2 were tentatively identified as 10-hydroxyevodiamine and 3-hydroxyevodiamine, respectively.
Metabolites M3 and M4
Metabolites M3 and M4, possessing the same deprotonated molecular ion [M–H]– at m/z 398.0813 (2.0 ppm, C18H12O5N3S), were detected at 15.81, and 16.44 min, respectively. This fragment ion at m/z 318 was observed by loss 80 Da than the precursor ion at m/z 398 in their MS2 spectra, suggesting the presence of one sulfate residue in. The MS3 of M3 and M4 possessed the same MS2 spectra with M1 and M2, respectively, suggesting the core structure of M3 and M4 were mono-hydroxylated of evodiamine. Therefore, M3 and M4 were tentatively characterized as 10-hydroxyevodiamine sulfate and 3-hydroxyevodiamine sulfate, which were new metabolites.
Metabolites M5 and M6
Metabolites M5 and M6 were eluted at 12.19, and 12.68 min, with the quasi-molecular ions of m/z 494.1573 (3.2 ppm, C25H24O8N3), and m/z 494.1575 (3.4 ppm, C25H24O8N3). This characteristic ion at m/z 318 was observed by loss 176 Da than the precursor ion at m/z 494 in their MS2 spectra, which indicated that they might be products of glucuronide conjugation of M1 and M2. Analyzing the clogP values of their potential metabolites, M5 and M6 were tentatively assigned as 10-hydroxyevodiamine Sulfate and 3-hydroxyevodiamine sulfate, which were new metabolites.
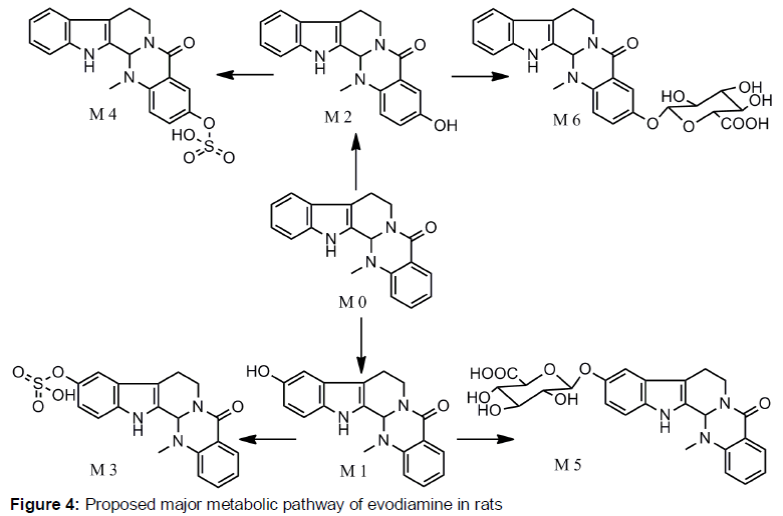
Proposed metabolic pathways of evodiamine
In this study, 7 metabolites (4 new) as well as parent drug itself were detected in the plasma. The proposed major metabolic pathways of evodiamine in the rat plasma are demonstrated in . In general, the metabolism of evodiamine in vivo was firstly undergone hydroxylation metabolic reactions (M1–M2), and then sulfate conjugation (M3–M4) and glucuronide conjugation (M5–M6) were taken place on the position of hydroxyl groups.
Discussion
An UPLC-LTQ-Orbitrap mass spectrometry method for analysis the metabolites of evodiamine was established at first. In order to obtain an appropriate elution system, mobile systems such as acetonitrile – water and methanol – water were tested. The result demonstrated that acetonitrile – water with a gradient elution mode could afford better resolution of chromatographic peaks among the metabolites and endogenous components.
The evodiamine metabolites under investigation belong to indoloquinazoline alkaloids, which make it predestined detection by ESI in positive mode. However, Negative mode was selected for ESI-MS analysis in this study, as it provided more intensity response and less mass spectral interference [16]. To our best knowledge, the biotransformation of evodiamine has been poorly understood, although some works on the metabolism of evodiamine have already been performed [8–11]. For example, only one and two metabolites were unambiguously identified from urine and feces of SD rats by comparing the retention time and mass spectrometry of metabolites from Microbial biotransformation [8,11]. Five metabolites were tentatively detected and characterize in human liver microsomes. It is worth mentioning that none metabolites was detected in rat plasma including parent drug. In our study, 7 metabolites including parent drug itself were detected and identified in rat plasma. However, the previously reported metabolite named N-demethylated evodiamine was undetected in both positive and negative MS modes in the present experiment, which might be because the species of experiment was different.
Conclusion
By online LC-MSn data acquisition and offline data processing methods of the software Xcalibur 2.1, a total of 7 metabolites were detected and identified based on accurate mass measurements, the fragmentation patterns and chromatographic retention times. The findings show that the profile of the metabolites of evodiamine in rats can provide greater insight into its pharmacological effects, metabolic fate in vivo, and bioactive components.
Declarations
Acknowledgement
References
Archives


News Updates